What does each page in the Cognocient dashboard show?
A visual guide to every Cognocient dashboard page — what each section shows, who it's for, and where to start.
After your 2-minute setup, here's exactly what you'll see across each dashboard page.
Engineering Dashboard (/dashboard)
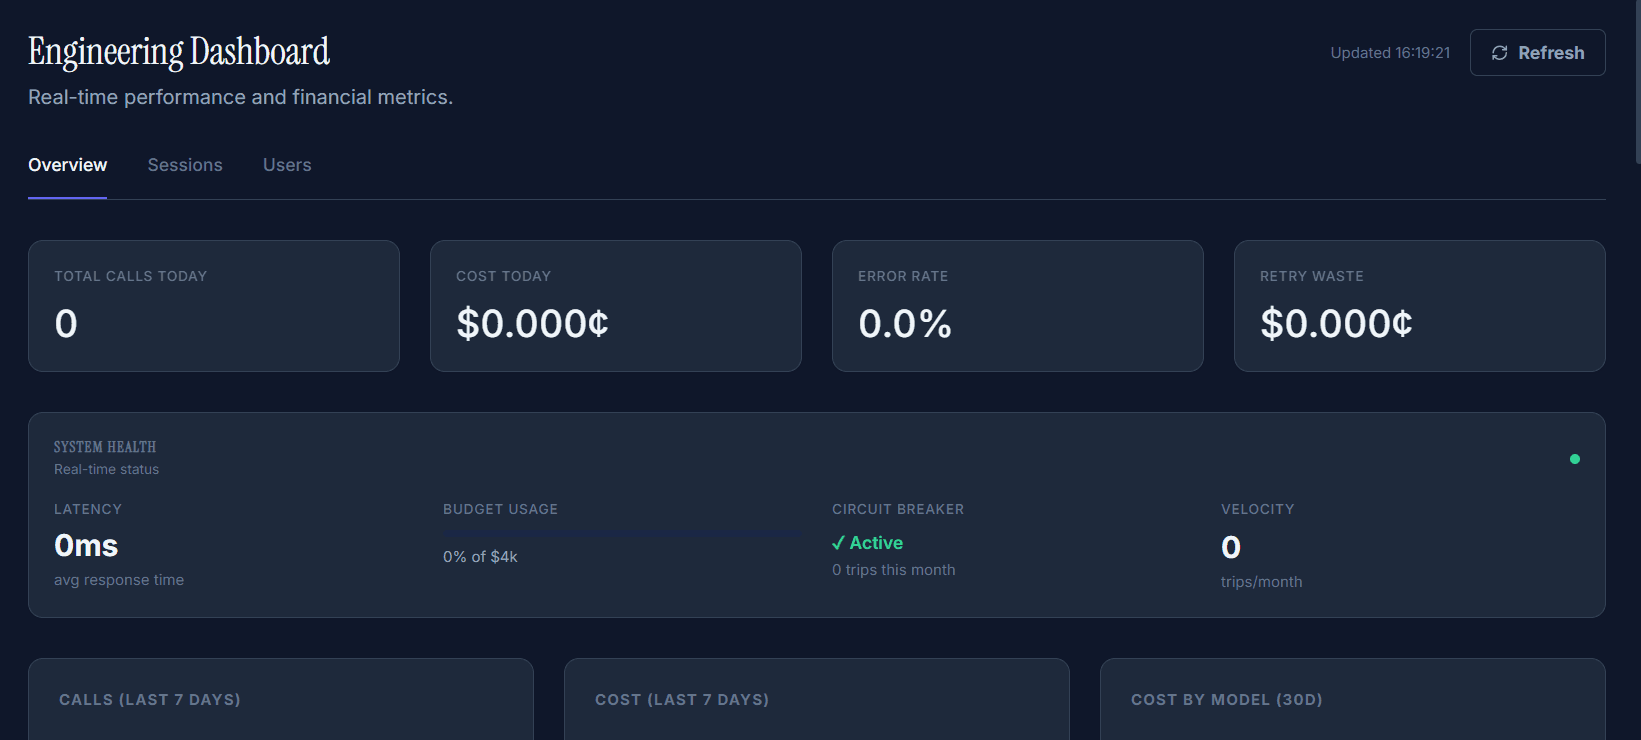
Engineering Dashboard: four real-time KPI cards (top), System Health bar with latency / budget / circuit breaker / velocity, and 7-day trend charts below.
The first page you land on. Real-time metrics from every API call.
Financial KPIs (top row — 4 cards)
| Card | What it shows | Why it matters |
|---|---|---|
| Calls Today | AI requests made today, vs yesterday | Spot usage spikes immediately |
| Cost Today | Spend for the day, vs yesterday | See if daily cost is trending up or down |
| Retry Waste | Spend from duplicate/failed calls | Money recoverable with better error handling |
| Error Rate | % of failed API calls, vs yesterday | High error rates correlate directly with retry waste |
System Health bar
A single-line status view of four critical metrics:
- Latency — Average response time (ms). Normal range: 50–200ms depending on model and provider.
- Budget Usage — Progress bar showing current spend vs monthly limit (e.g., "42% of $10,000").
- Circuit Breaker — Prevents runaway agents. Shows ✓ Active and trip count. A "trip" = the system stopped an infinite-loop workflow.
- Velocity — How often the circuit breaker has triggered. Protects against agents burning budget in loops.
Charts (bottom section)
| Chart | What it shows |
|---|---|
| 7-day calls trend (area) | Call volume over the past week — helps with capacity planning |
| 7-day cost trend (bar) | Cost per day — spot which days are most expensive |
| Cost by model (donut) | Spend breakdown across all models (GPT-4o, Claude, Gemini, etc.) |
Where to start
Check the Retry Waste and Error Rate KPI cards first. High retry waste is the fastest-payback optimization in most deployments.
Executive Overview (/executive)
For CFOs and finance teams. Shows what the board cares about.
Primary KPI cards (top row)
| Card | What it shows |
|---|---|
| Total AI Spend | Total spend this billing period |
| vs Budget | % of monthly budget consumed |
| Budget Status | Categorical: Healthy / At Risk / Blocked |
Secondary metrics
- AI Efficiency Score (0–100) — Board-level KPI showing how optimized your AI spend is. Factors in waste detected, recommendations applied, and model right-sizing.
- Cache Savings — How much you saved this month from prompt caching. Demonstrates ROI of cache adoption.
ROI Summary cards
Three cards showing Cognocient's financial impact:
- Spend Protected — AI budget shielded from runaway agents and anomalies
- Waste Recovered — Recoverable spend identified across all 5 waste categories
- Cognocient ROI — Protection and recovery vs your subscription cost (e.g., "14×")
Recoverable waste widget
A compact summary of total recoverable spend this month, broken down by category, with a link to the full waste report. Clicking "See full waste report" opens the detailed bloat analysis at /executive/waste/bloat.
Generate Report button
One click produces a board-ready PDF containing:
- AI-written narrative analysis (generated by Claude)
- Spend breakdown by department and model
- Waste recovered this month
- AI Efficiency Score
- Year-over-year comparison (when available)
- Top 3 recommendations ranked by savings impact
Monthly board prep
Click Generate Report one week before your board meeting. Share the PDF directly — no spreadsheet assembly required.
Budgets (/budgets)
Manage and enforce spending limits in real time.
Top metric cards
| Card | What it shows |
|---|---|
| Total Spend | Sum of all spend across all budgets this month |
| Active Budgets | How many budget rules you've configured |
| Alerts Triggered | How many threshold breaches happened this month |
Budget cards
Each budget is displayed as a card (not a table row) with:
- Name — e.g., "Customer Support", "Engineering Tools"
- Progress bar — Visual spend vs limit, color-coded:
- Green
<80%— Healthy - Amber
80–95%— At Risk - Red
>95%— Blocked / near breach
- Green
- Enforcement mode:
ALERT ONLY— Notify but allow requestsBLOCK— Return429, stop requests when limit is hitMONITOR— Track only, no restriction
Search
Use the search box to filter budgets by name, scope type, or scope value. Useful for organizations with many budget rules.
Recommendations (/dashboard/recommendations)
AI-generated optimization opportunities, ranked by monthly savings impact.
Recommendations appear within 24 hours once Cognocient has analysed your spend patterns. Each card shows estimated monthly savings, confidence score, and a one-click Apply button.
Savings KPI card (top)
A green card showing the total monthly opportunity across all pending recommendations — e.g., "$2,340 / month recoverable across 7 recommendations."
Filter tabs
Filter by category to focus on the area you're optimizing.
Recommendation cards
Each card shows:
- Title — e.g., "Switch search feature to gpt-4o-mini"
- Confidence — How certain Cognocient is the recommendation will work (89% = high)
- Estimated savings — Monthly dollar impact
- Apply button — Applies the change immediately (routing rule update, cache enable, etc.)
- Dismiss link — Hides without deleting; won't affect your recommendations score
Start with highest confidence
Sort by confidence first. A 94% confidence + $340/month recommendation is safer to apply than a 45% confidence + $800/month one.
AI-Generated Insights (/dashboard/insights)
Nightly pattern analysis surfaced as actionable cards.
Filter chips
- Warning — Unexpected spike or degradation detected
- Opportunity — Cost optimization available
- Pattern — Behavioral insight (e.g., "80% of errors occur 2–4 PM UTC")
- High Urgency — Requires immediate attention
Insight cards
Each card contains:
- Discovery — AI-written finding in natural language
- Impact — Quantified business impact (e.g., "40% higher cost than necessary")
- Urgency badge — High / Medium / Low
- Resolved button — Marks as acted on
- Dismiss (×) — Hides from view without marking acted on
Insights are generated every night from your API call patterns, model choices, waste trends, and budget health. They appear in order of savings impact (highest first).
Sessions (/dashboard/sessions)
Groups all API calls that share the same X-Cost-Session ID into a single logical interaction. Shows cost per session, turn count, duration, and waste flags like "Context bloat."
| Column | What it shows |
|---|---|
| Session ID | Your value from X-Cost-Session — ticket ID, conversation ID, etc. |
| Total cost | Sum of all API calls in this session |
| Calls | Number of individual API calls |
| Duration | Time from first to last call in the session |
| Waste flags | Context bloat, retry waste, model mismatch detected in this session |
Click any session to see the full call tree — every API call in order with model, tokens, and cost at each step.
Workstreams (/dashboard/workstreams)
Groups API calls by X-Cost-Session when the session ID matches a JIRA story, GitHub PR, or agent task UUID. Designed for engineering managers and sprint reviewers who need AI cost per work item.
| Column | What it shows |
|---|---|
| Workstream ID | JIRA-2341, pr-892, or a UUID for agent task runs |
| Feature | The X-Cost-Feature tagged to these calls |
| Total Cost | Sum of AI spend for all calls in this workstream |
| Calls | Total API calls triggered by this work item |
| Avg/Call | Cost efficiency signal |
| Duration | Time span from first to last call |
| Models | All models used across this workstream |
Filter options: Date range (7/30/90 days), search by session ID, filter by feature.
Use this view in sprint reviews to answer: "We spent $X on AI last sprint — which stories drove it?" See Workstream Attribution for the tagging setup.
Users (/dashboard/users)
Shows per-user AI spend for every unique X-Cost-User value you send. Sorted by total cost descending.
| Column | What it shows |
|---|---|
| User ID | Your internal user ID (from X-Cost-User) |
| Total spend | All AI cost attributed to this user |
| Calls | How many requests this user triggered |
| Avg cost/call | Rising avg means prompts are getting longer |
| Sessions | Number of distinct conversation sessions |
| Last active | Detect dormant users still incurring cost |
Click any user row to drill into their sessions and call history, or click Set budget to cap their monthly spend.
AI Cost Advisor (/dashboard/advisor)
Ask questions about your AI spend in plain English. Business plan feature.
The advisor is powered by your connected AI provider (Anthropic or OpenAI) and answers questions grounded in your last 30 days of usage data. Each question is billed to your own API key — Cognocient does not charge separately.
Example questions:
- "Why did our AI spend increase 40% last month?"
- "Which features are driving the most waste?"
- "What would our spend look like if we switched to gpt-4o-mini for all classification tasks?"
Where to start
| Your goal | Go to |
|---|---|
| See real-time API metrics | Engineering Dashboard |
| Prepare board materials | Executive Overview → Generate Report |
| Set spending limits | Budgets |
| Cut costs in one click | Recommendations |
| Understand patterns | Insights |
| Ask a question about spend | AI Cost Advisor (Business plan) |
Related articles